C++/C# programmer
Developed in January 2020
For the second project in my first year of university, we were tasked with creating a CPU raytracer.
The project was focused on linear algebra, (spatial) data structures, unit testing, lighting, project structure, and optimization techniques.
Rather than attempting to get my raytracer to run in real-time, I decided to focus on comparing several spatial structures and on implementing several types of shape primitives that can be placed in the scene.
I believe this gave me a better understanding of the inner workings of data structures and a better grasp of linear algebra in a 3D space.
We weren’t allowed to use anything in the std namespace or any third-party libraries other than a select few.
This meant I had to write my own math library and data structures.
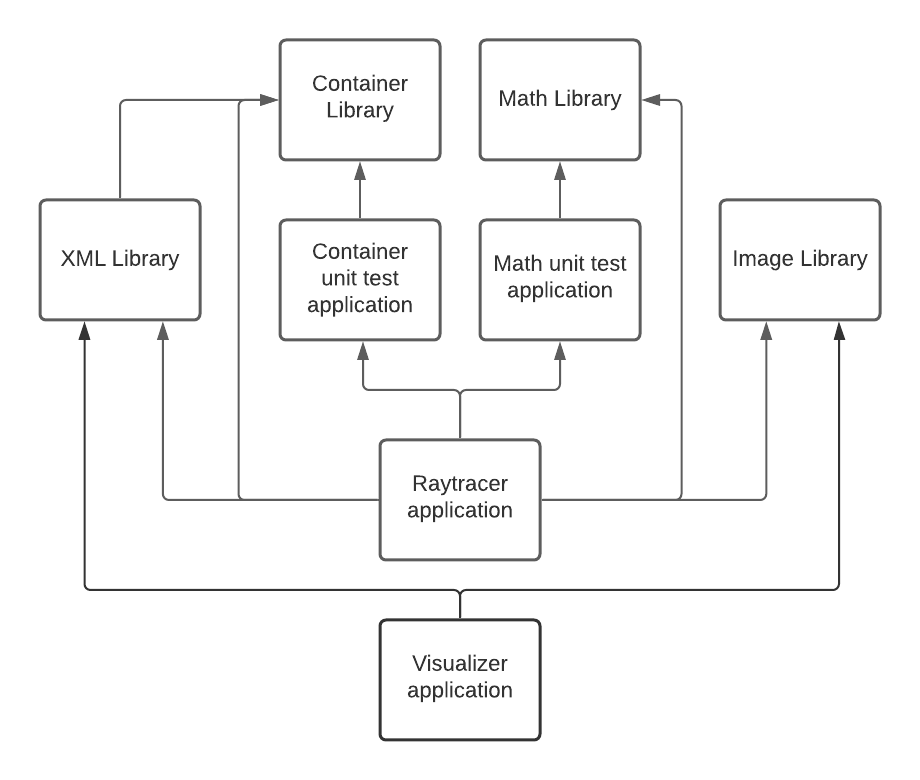
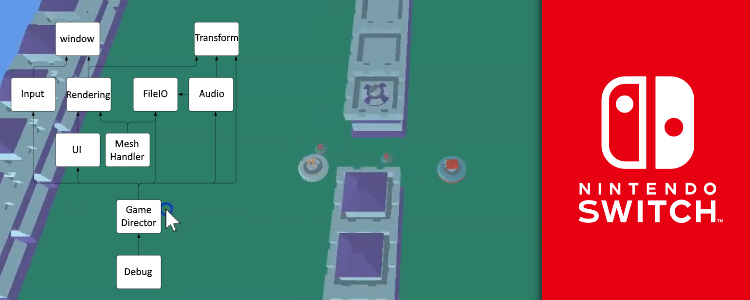
Dependency diagram of the project setup of the ray tracer
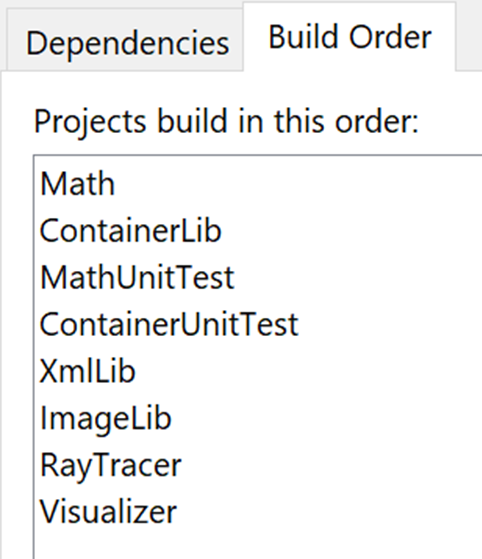
The result of the created project dependencies is this build order in the visual studio solution
This was the first time I had to set up my own C++ project from scratch for university, which is why I’ll discuss it here.
I wanted unit tests to run during the build process, so I wrote them in separate executable projects and had the raytracer project depend on them.
This would ensure those applications would be built and available to run in the pre-build step of the raytracer.
To allow the unit test projects to access the code I wanted them to test, I had said code divided into library projects.
There was one “Math” project (vectors, matrices, helper functions) and one “Containers” project (array, vector, string, stack, etc.).
Both of these libraries had their own unit test project.
To analyze some data related to the performance of different spatial structures, I added a “Visualizer” project.
This was a console application that could take in a file with data gathered while running the raytracer and create diagrams to visualize a tree structure or graphs to compare performance on progressively larger scenes.
To serialize and deserialize the data for the visualizer, I also added an improved version of my XML parser from my previous project.
This was used by the raytracer to save gathered data, and by the visualizer to read that data.
Since both the raytracer and the visualizer had to deal with creating images and saving them to files, I decided to create a simple “ImageLib” project that implements some code to simplify this process.
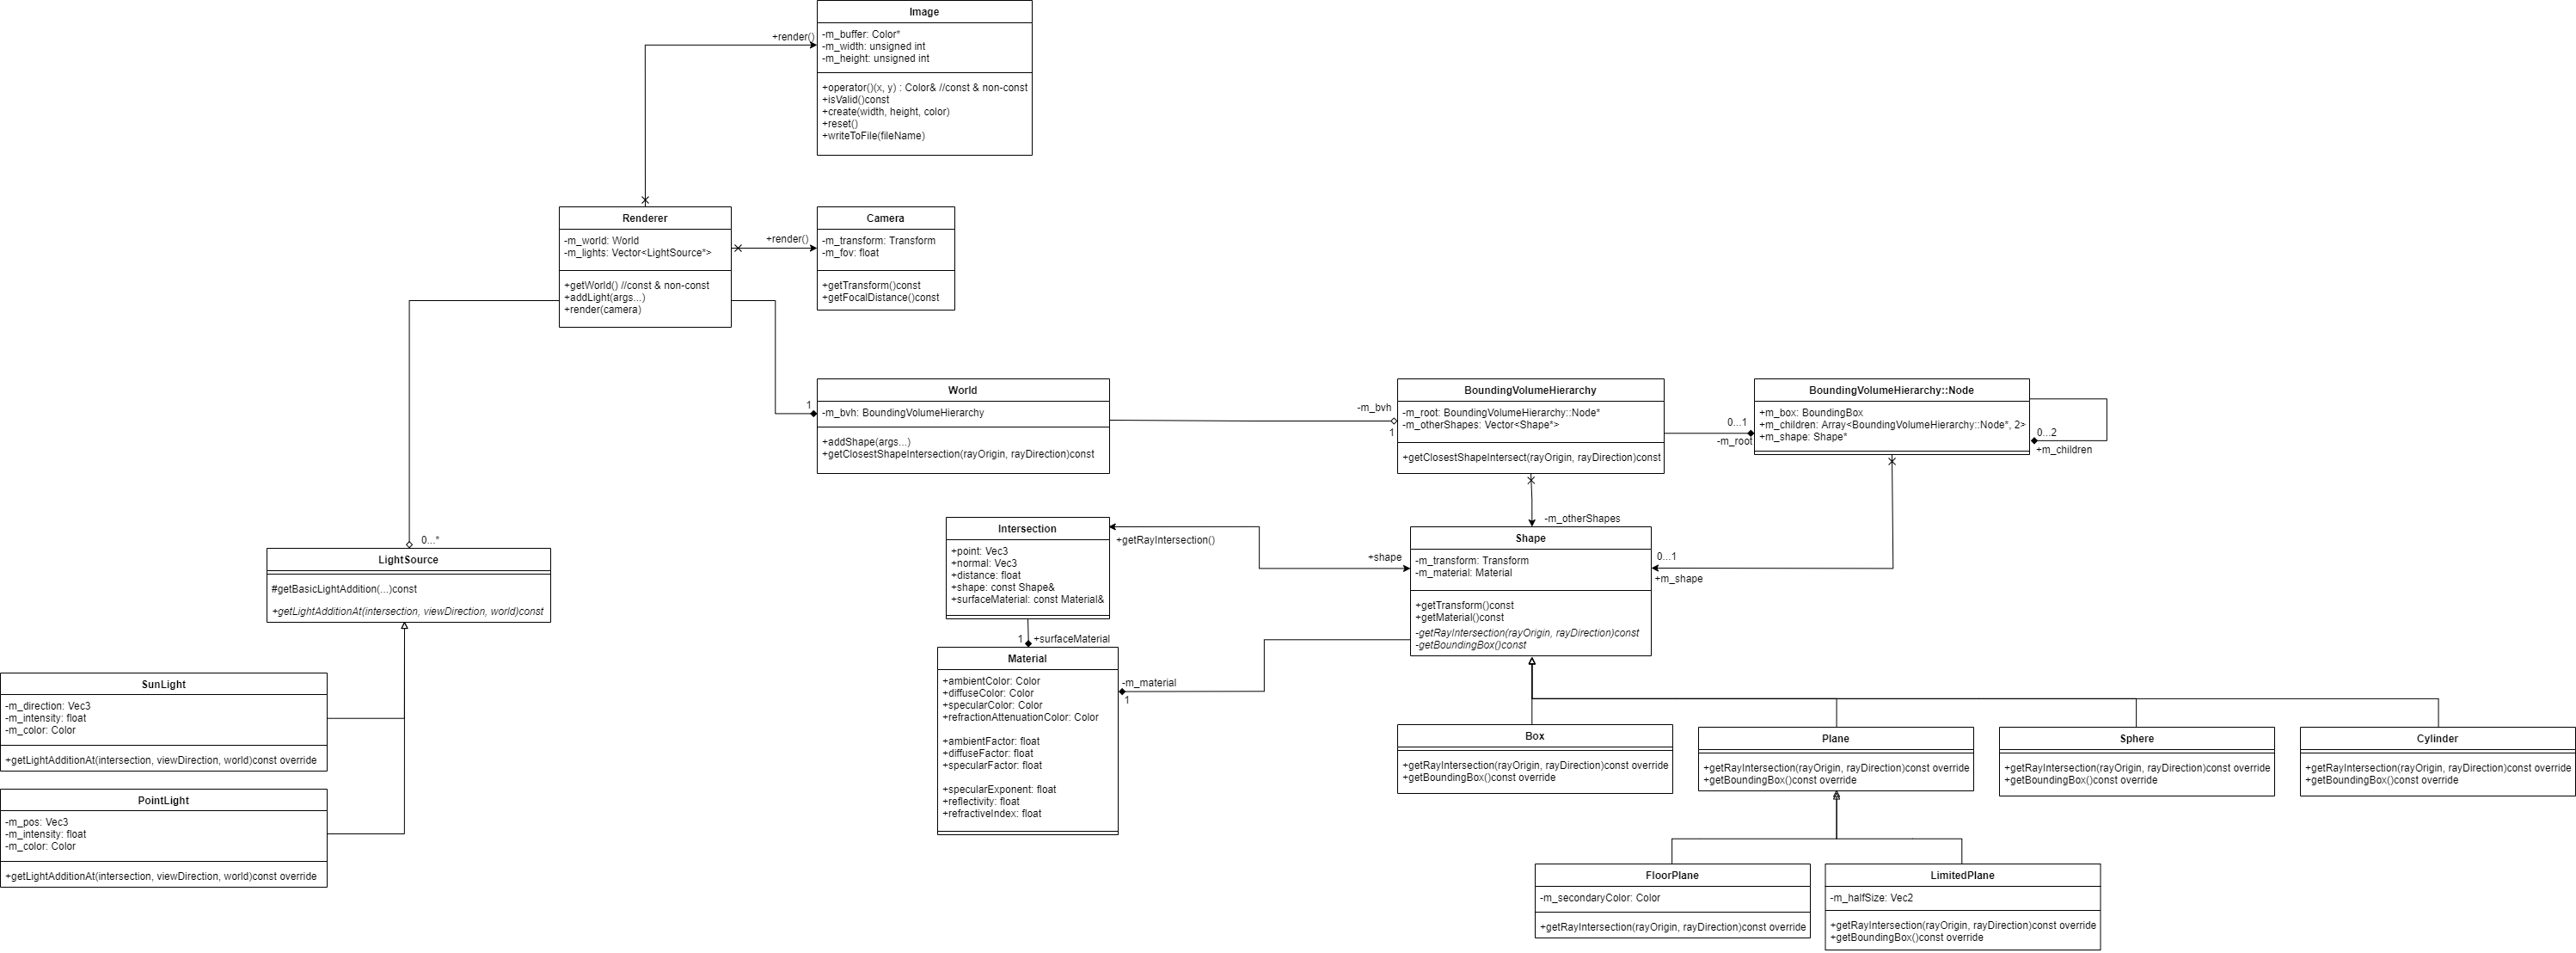
UML class diagram of the ray tracer
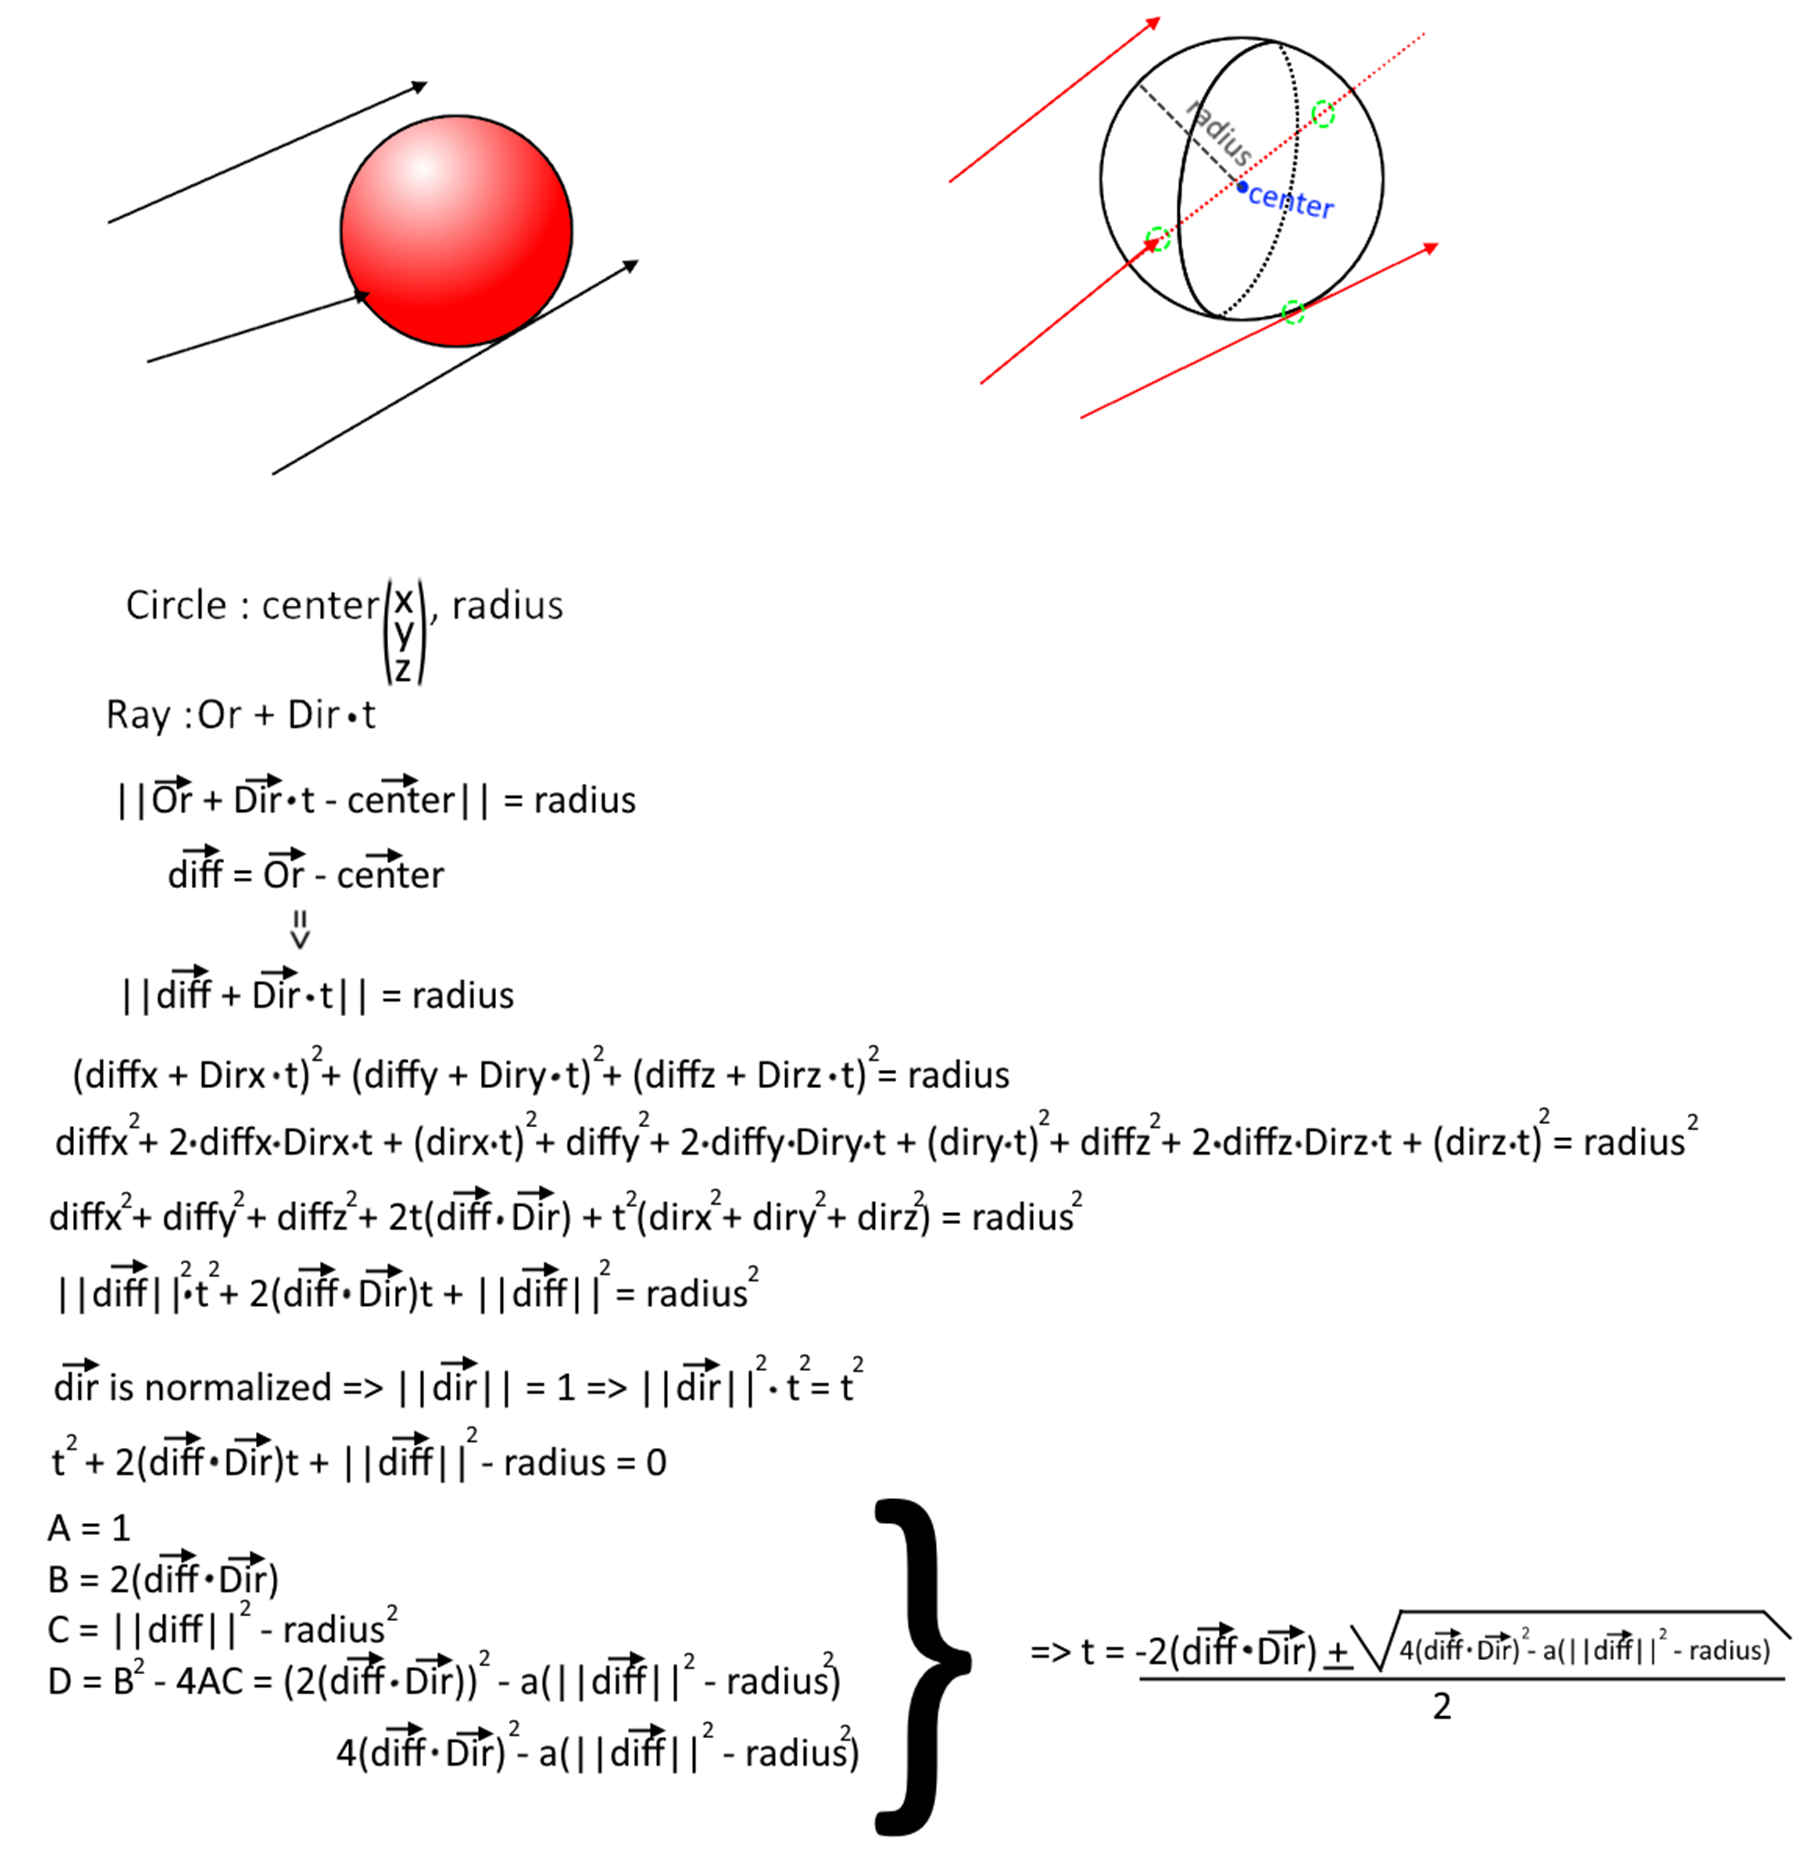
Digitalized version of the notes I wrote to figure out the math behind ray-sphere intersection
I did all the math for the camera and ray-primitive intersections myself by hand.
This gave me a solid understanding of the math behind these concepts and a better grasp of linear algebra in a 3D space.
I barely used matrices at all for this project.
Although this would have been very useful for the camera, I learned a lot by treating everything as pure vector math.
This gave me a much better understanding of what is actually happening when you do use matrices as well.
I have worked more with matrices in later projects, the next university project being the first example.
](/content/images/posts/RayTracerCameraMath.png)
Digitalized version of the notes I wrote to figure out the math behind a 3D camera
(no matrices were used)
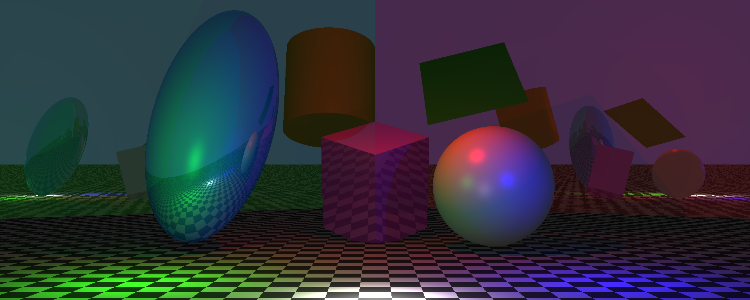
![All shape primitives supported by the raytracer[br]Also showcasing translation, rotation, and scaling](/content/images/posts/RayTracerPrimitives.png)
All shape primitives supported by the raytracer
Also showcasing translation, rotation, and scaling
The shape primitives I implemented were:
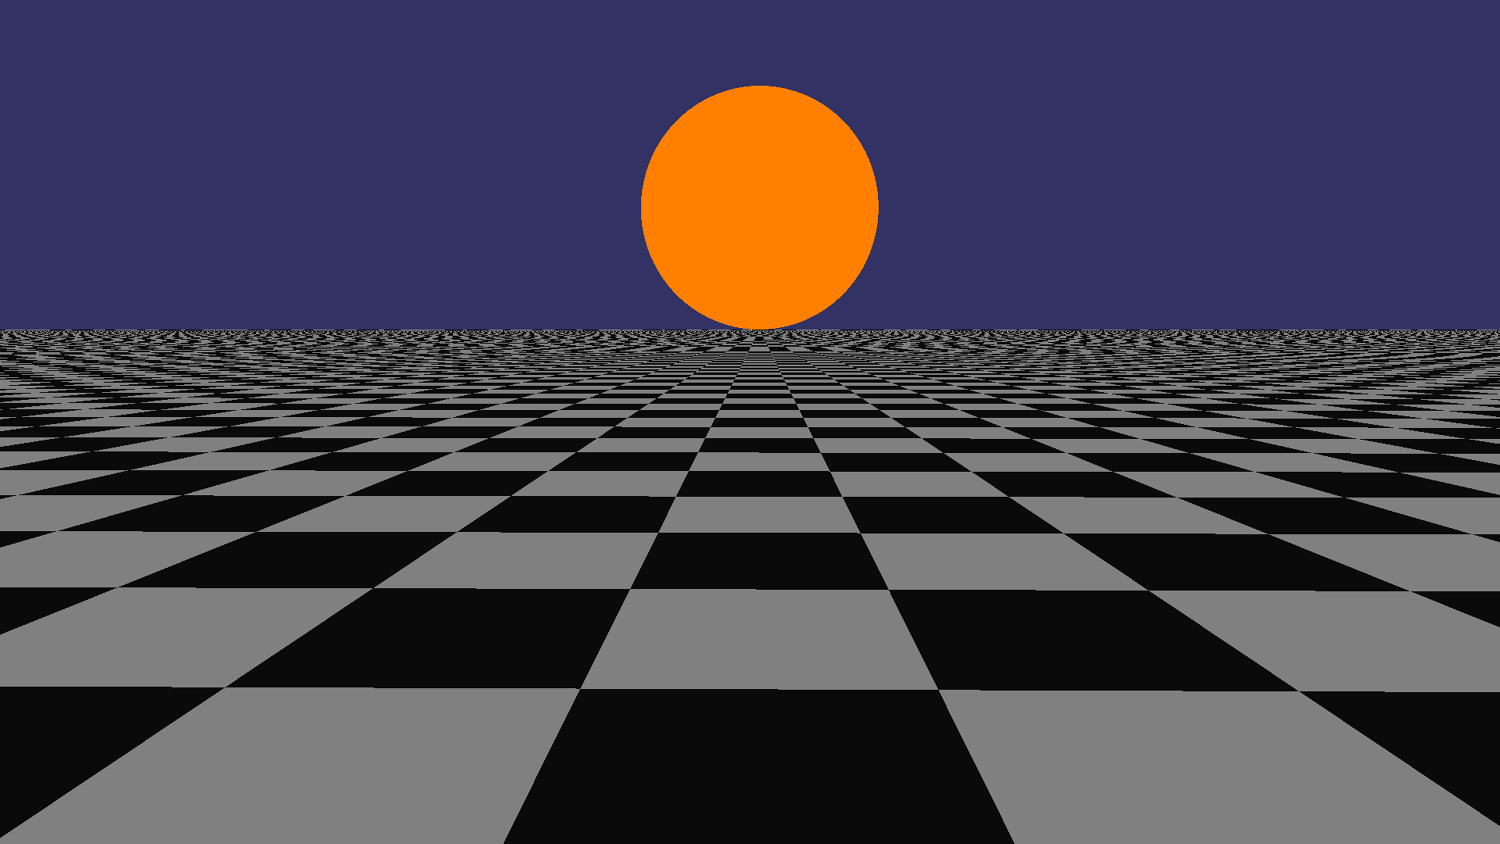
A sphere and a checkerboard plane rendered before any kind of lighting was implemented
The renderer started out by simply giving the color of a shape to the pixel that intersects with said shape. This means there is no kind of lighting at all, but it does show that the shapes are where they're supposed to be and that the camera is working correctly.
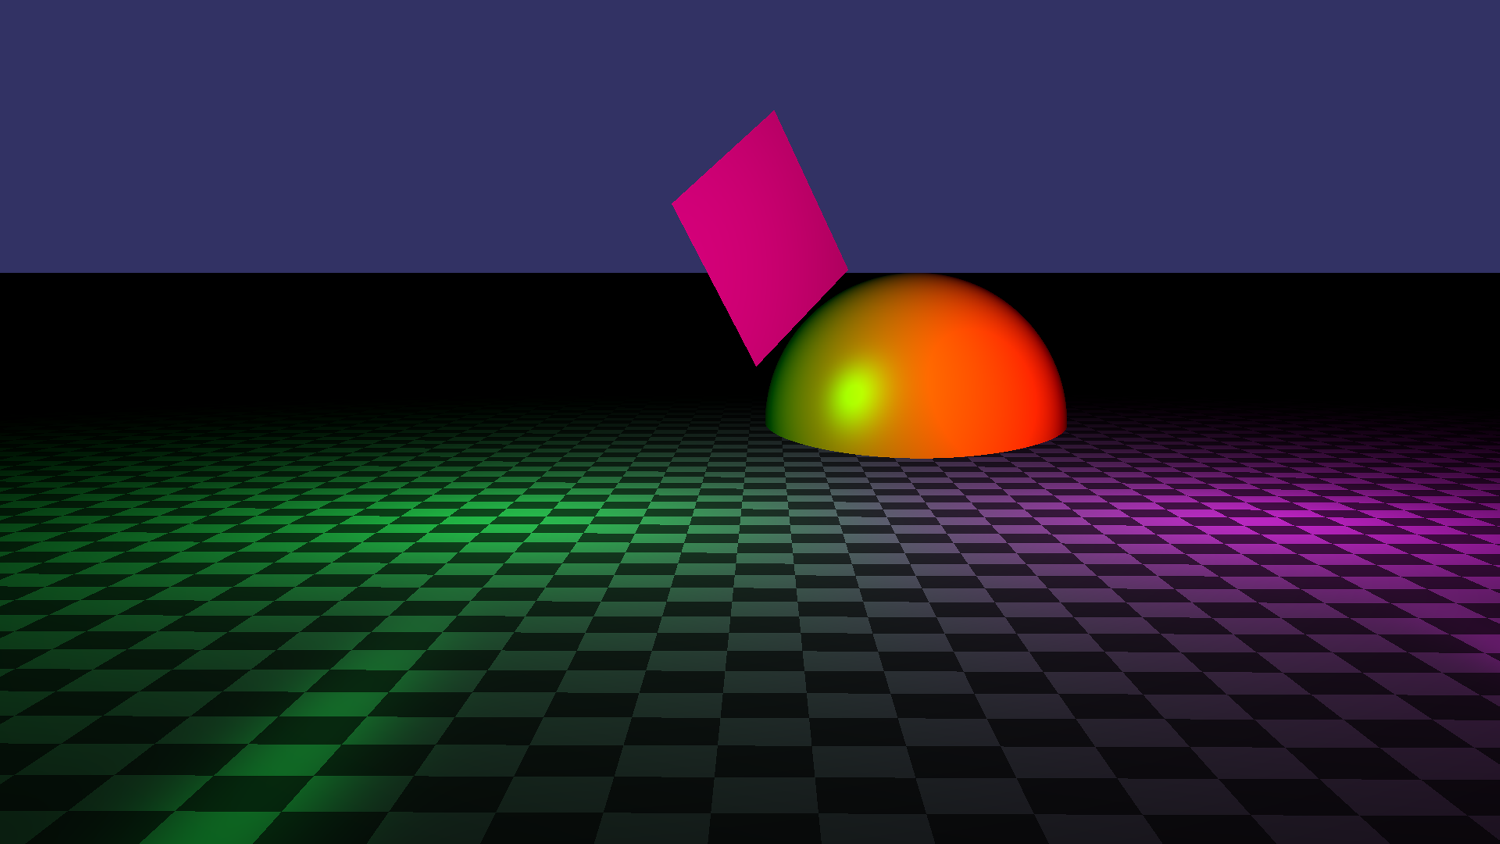
![Simple lambert shading being showcased in the scene by two colored lights.[br][br]The scene contains the previous sphere and checkerboard plane, but I also added a non-infinite plane that goes inside the sphere](/content/images/posts/RayTracerColoredLights.png)
Simple lambert shading being showcased in the scene by two colored lights.
The scene contains the previous sphere and checkerboard plane, but I also added a non-infinite plane that goes inside the sphere
I then added simple lambert shading, which means there is only diffuse lighting in the scene.
This already made a big difference in how the scene looked.
I also made sure to support colored lights from the start, this wasn't an issue for me because I already had some experience with lighting models from my university intake project.
Specularity showcased in a scene similar to the previous one
I then added specularity, which is quite simple again and also supports colored lights from the start.
The specularity of a shape is simply determined by a material value, it would have been interested to add texture mapping to this, but that was outside the scope and purpose of this project.
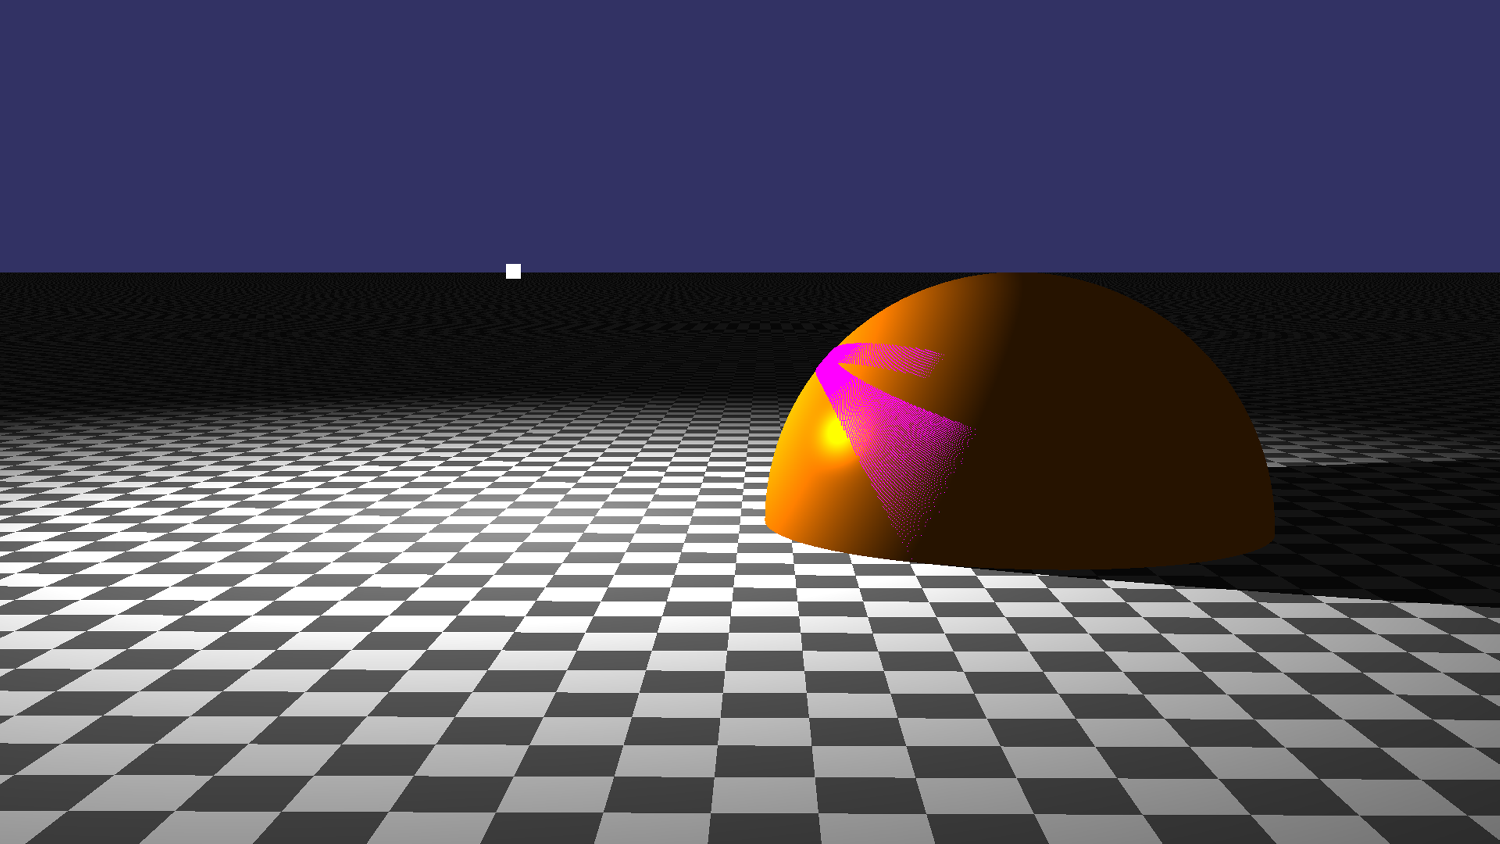
![Reflections and shadows are showcased by this reflective sphere with a light source next to it. The sphere isn't fully reflective, which is why it still has an orange glow to it. [br][br]The white square is a visualization of the light source and is discussed in the debug rendering section](/content/images/posts/RayTracerReflectionShadow.png)
Reflections and shadows are showcased by this reflective sphere with a light source next to it. The sphere isn't fully reflective, which is why it still has an orange glow to it.
The white square is a visualization of the light source and is discussed in the debug rendering section
I then moved on to reflections and shadows.
Reflections were surprisingly easy since it's just the combination of the usual color and the color of a reflected ray, though I did put a limit on how deep that recursion can go.
Shadows weren't very difficult either, since I already had to find the light sources that would affect every pixel I could simply check for each one if they are blocked by another shape with the same ray-primitive intersection math I already had.
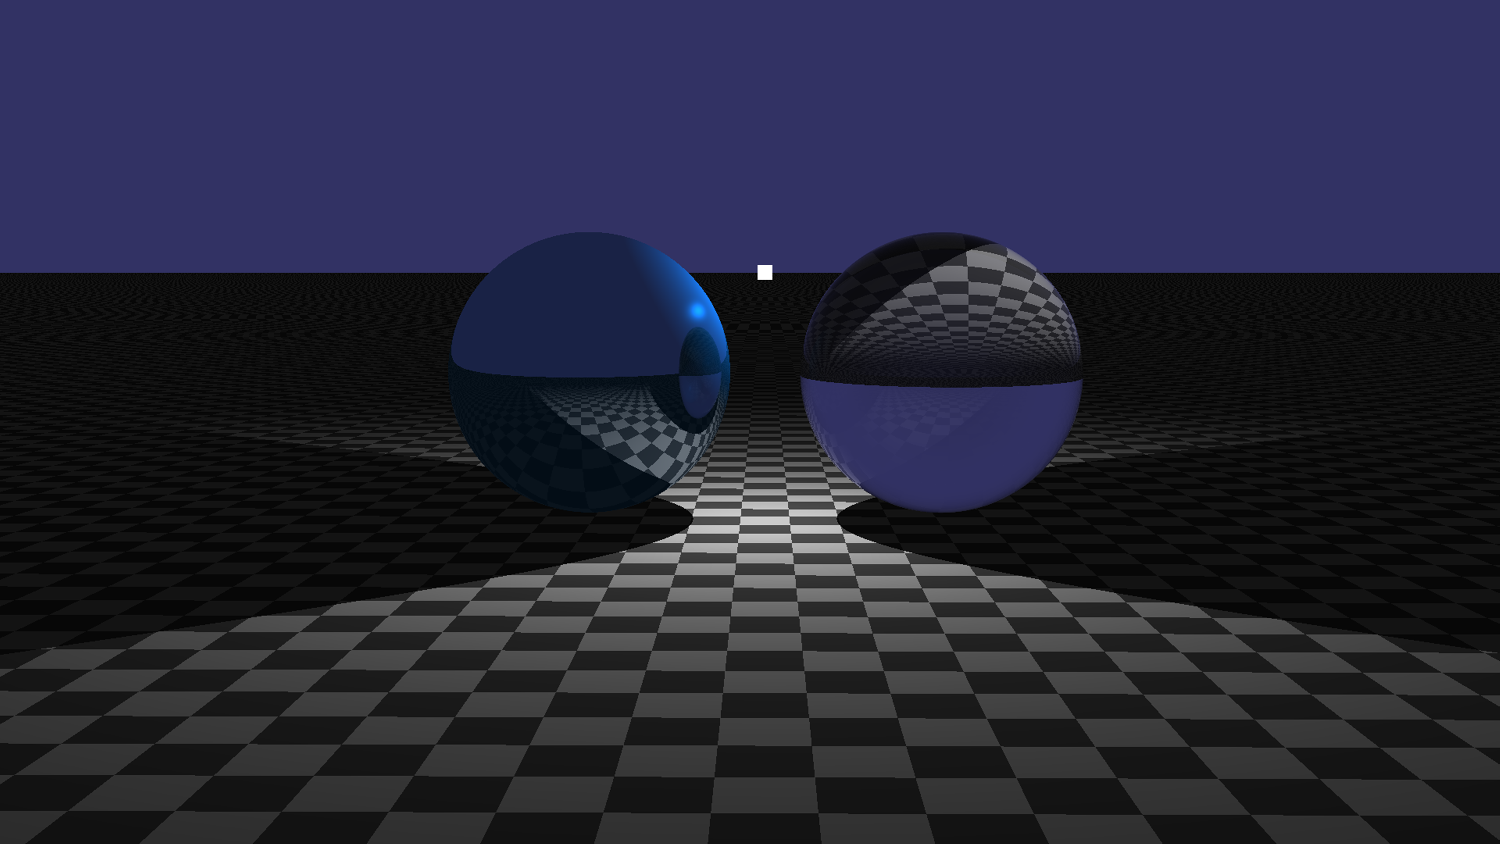
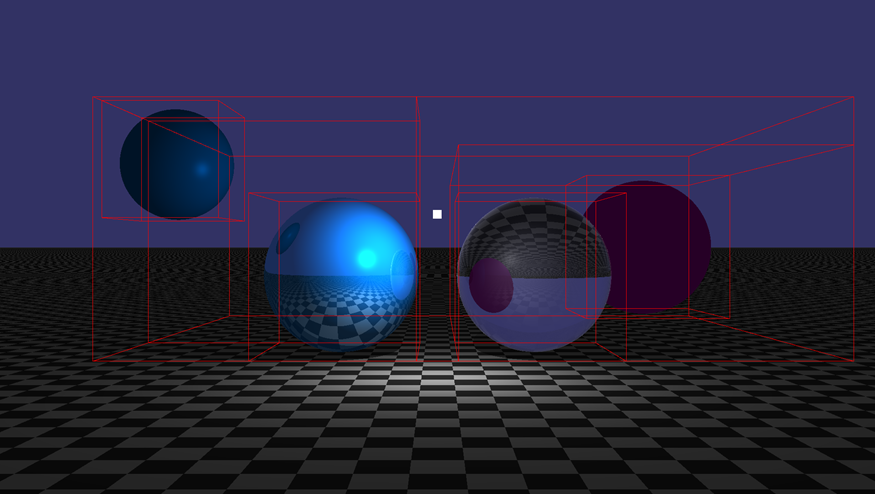
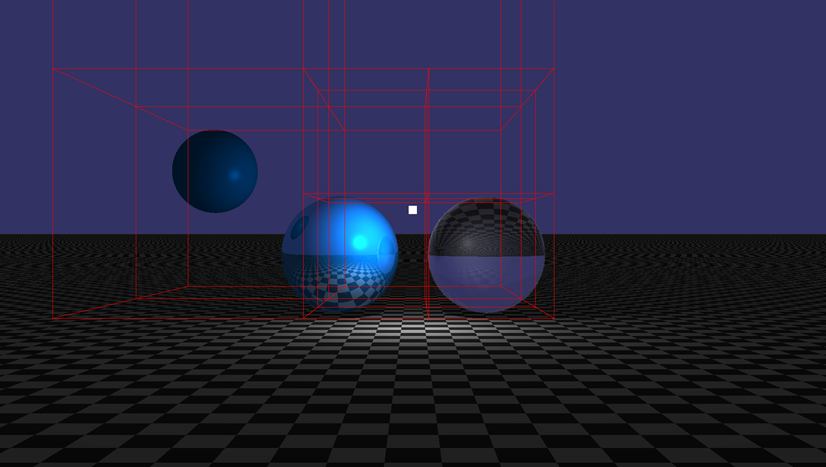
Refraction being showcased in a simple scene. The left sphere reflects and the right sphere refracts
Refraction was quite difficult because the math for it is a bit complicated.
I was eventually able to implement it though.
A part of this process was to support a ray going through several refractive media and still using the correct refraction index.
I did this by implementing a stack (we weren't allowed to use the STL), pushing the new refraction index when entering a medium, and popping when exiting a medium.
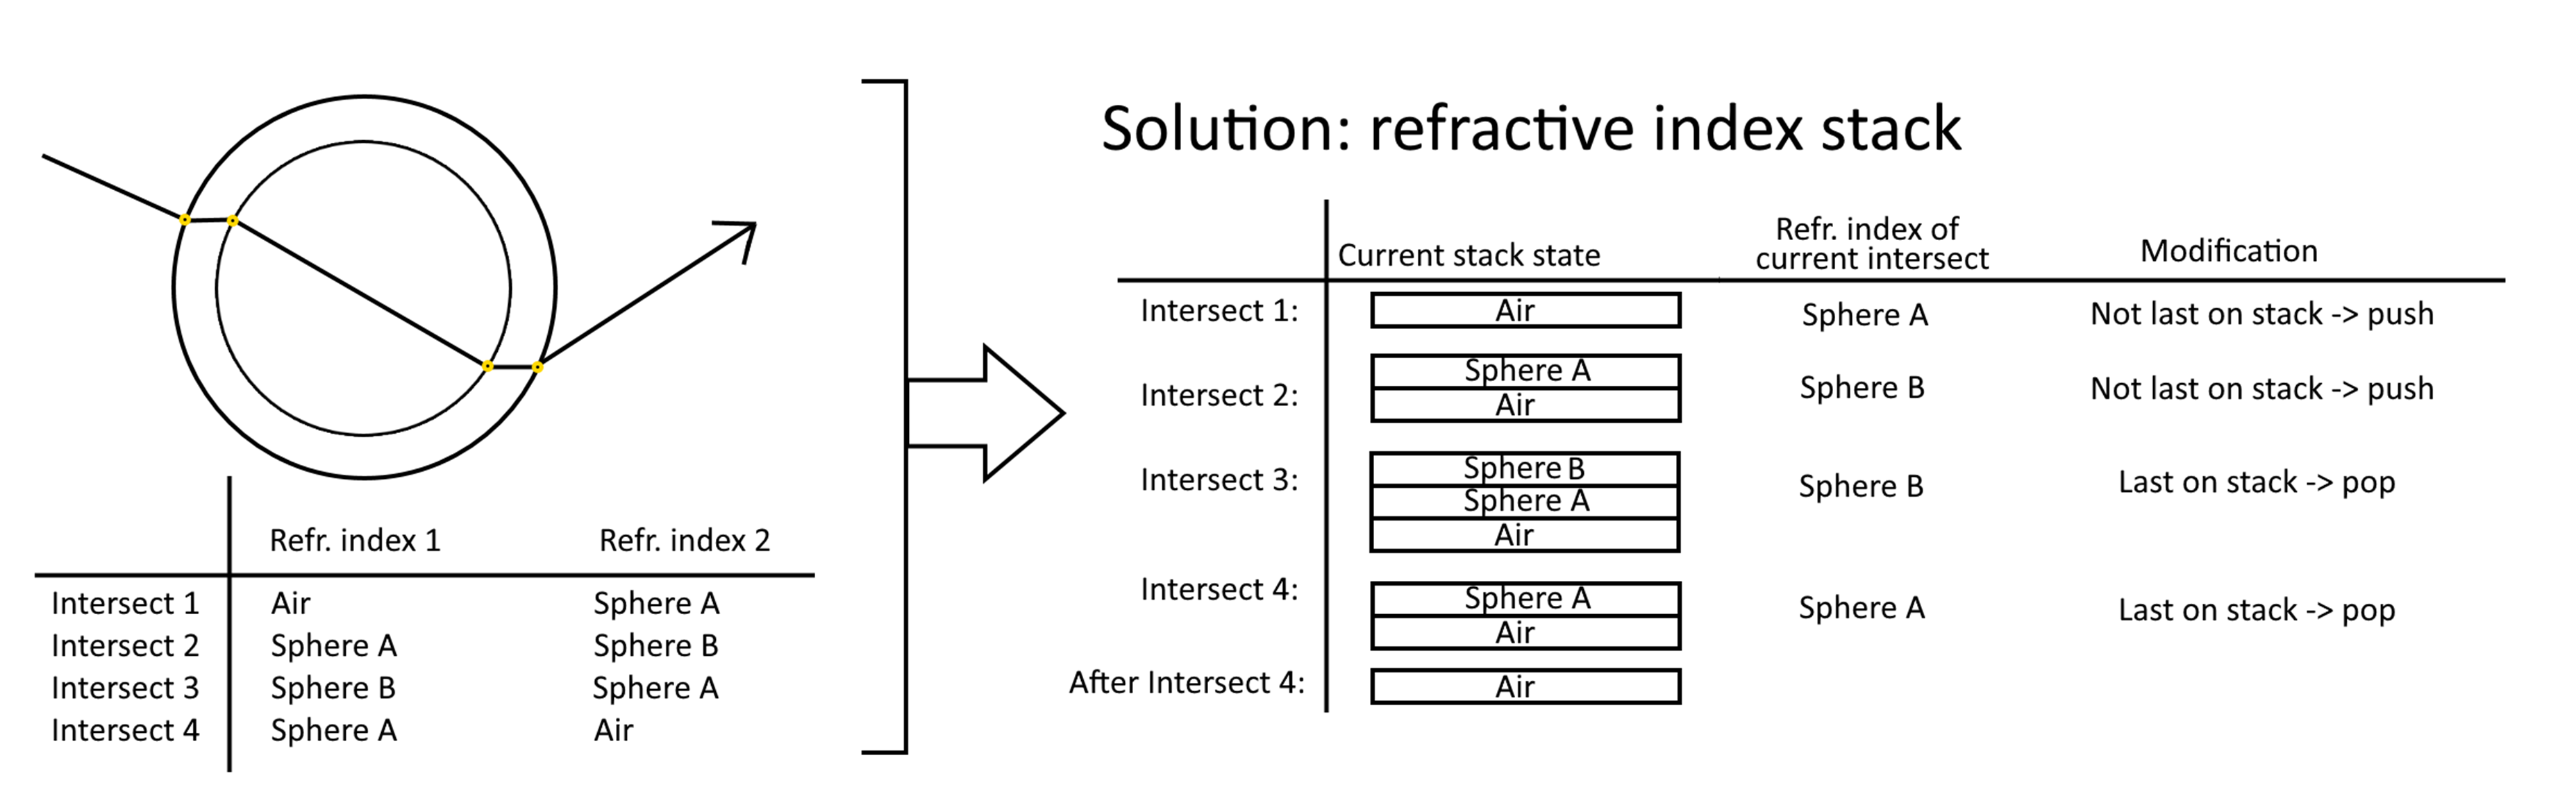
The concept of the refraction index stack explained with a hypothetical use case
Bounding Volume Hierarchy visualized by creating debug lines for the edges of all the boxes
Since any graphics task can be difficult to debug, I quickly figured it would be productive to invest some time in debug rendering. I ended up reverse-engineering the math of the camera to write something like a rasterizer for points and lines. Both points and lines were eventually given a variable for thickness so they could be more easily visible. They can also be set to either use or not use depth, so for some, you can choose to see them through objects while for others you might not.
![I had a bug where shadows wouldn't render correctly, so I decided to verify the light-blocking geometry by placing debug points to the impact points of blocked rays.[br][br]You can clearly see that these points do not align with the sphere as they should](/content/images/posts/RayTracerDebugRenderingNoFix.png)
I had a bug where shadows wouldn't render correctly, so I decided to verify the light-blocking geometry by placing debug points to the impact points of blocked rays.
You can clearly see that these points do not align with the sphere as they should
Since the debug rendering showed me exactly where the problem was, I was able to find and fix it easily. Here you see the result where both the shadow and debug points behave as expected
Since we weren't allowed to use the STL or third-party libraries, I had to implement several data structures myself. Some of these were containers, and they were made in this ContainerLib project and unit tested in the ContainerUnitTest project.
Array
This is just a class that represents a normal, statically sized, array.
I write it to make it slightly easier to work with arrays.
Ironically, it seems I made it create a dynamically-allocated array despite the size of it being a template parameter.
That isn't really necessary since the size of the array is known at compile-time, meaning I could have just made a statically sized array on the stack instead, which would prevent an unnecessary indirection in memory.
Stack
This is a stack like any other, supporting a push and a pop that follow the LIFO (last in, first out) order
It was implemented as a linked list but this is entirely encapsulated in the private scope of the class.
Optional
Like its STL equivalent, this is just a wrapper around a pointer that acts as an optional value so that you can return "nothing" as a null pointer without having to pass around raw pointers.
Vector
This is a counterpart to std::vector, so just a dynamically sized array that increases its size when necessary.
I simply made my implementation reserve twice the previously reversed memory when it runs out of slots.
I also implemented iterators so that I could support things like range-based for-loops and I used malloc rather than new[] so that it could support types without a default constructor.
String
The string was very similar to the vector class, but it added some extra functionality like comparison, finding characters, getting a c-string, toUpper/toLower, and conversions to and from numerical types.
There were also spatial data structures, meant for optimizing the ray-tracer by reducing the intersection tests as a broad phase. These were implemented in the main RayTracer project and not unit tested, though they were often visualized by debug rendering, visualizing their tree structures, and visualizing their performance as more objects are added.
Octree
In-scene octree visualized by the debug renderer
The first spatial data structure I implemented was an octree. This was because it was relatively simple to implement and because I was curious about comparing its results to those of a BVH.
![How the octree was partitioned[br]k is the index of the subnode, vec is a vec3 of integers that are 1 or -1 to show which corner of the parent node you're looking for](/content/images/posts/RayTracerOctreeSetup.png)
How the octree was partitioned
k is the index of the subnode, vec is a vec3 of integers that are 1 or -1 to show which corner of the parent node you're looking for
In the end, the octree didn't work as nearly well as the BVH.
This was because the shapes in the scene were distributed in very irregular ways, which an octree is much less suited for because it partitions space in a grid-like way.
An octree would work much better for something like a voxel-based world, but it's not very good for a world where any number of shapes can be any size and anywhere.
Node structure of an octree visualized by the data visualizer
Bounding Volume Hierarchy
In-scene BVH visualized by the debug renderer
I then moved on to implementing a BVH in hopes of getting something more suited for my use case.
I implemented two types of BVH, one with bottom-up partitioning and one with top-down partitioning.
When partitioning from the bottom-up, you take all your shapes and sort them by where they are along the largest axis, then you make pairs from those shapes and put them in a parent node, then you repeat the process with those parent nodes until you are left with a single root.
This produced a very balanced tree, but also a lot of overlap between nodes, which hurts the performance because fewer nodes can be discarded when querying for intersections. This is because overlap isn't taken into account with this approach at all.
When partitioning from the top-down, you take the box around all your shapes and cut it in half on its largest axis, then you put all shapes on both sides into respective child nodes and repeat this process until you're left with only single-shape leaf nodes.
This approach produces a slightly less balanced tree, but there is no overlap between nodes.
This is because the approach explicitly cuts the nodes from one another when constructing the tree.
![How all spatial structures performed against one another visualized by the data visualizer[br]The vertical axis is how much time it took to render[br]The horizontal axis is how many shapes were added to the scene](/content/images/posts/RayTracerAllPerformance.png)
How all spatial structures performed against one another visualized by the data visualizer
The vertical axis is how much time it took to render
The horizontal axis is how many shapes were added to the scene
![How the BVH performed against the octree visualized by the data visualizer[br]The vertical axis is how much time it took to render[br]The horizontal axis is how many shapes were added to the scene](/content/images/posts/RayTracerBVHvsOctree.png)
How the BVH performed against the octree visualized by the data visualizer
The vertical axis is how much time it took to render
The horizontal axis is how many shapes were added to the scene
The top-down partitioned BVH was clearly superior in terms of performance to both the bottom-up BVH and the octree.
This is because its construction cares more about the distribution of the nodes, which also happens to be the purpose of the data structure.
I am glad I attempted to implement an inferior structure before I found the right approach because it taught me to consider how a data structure should work in relation to what its purpose is.
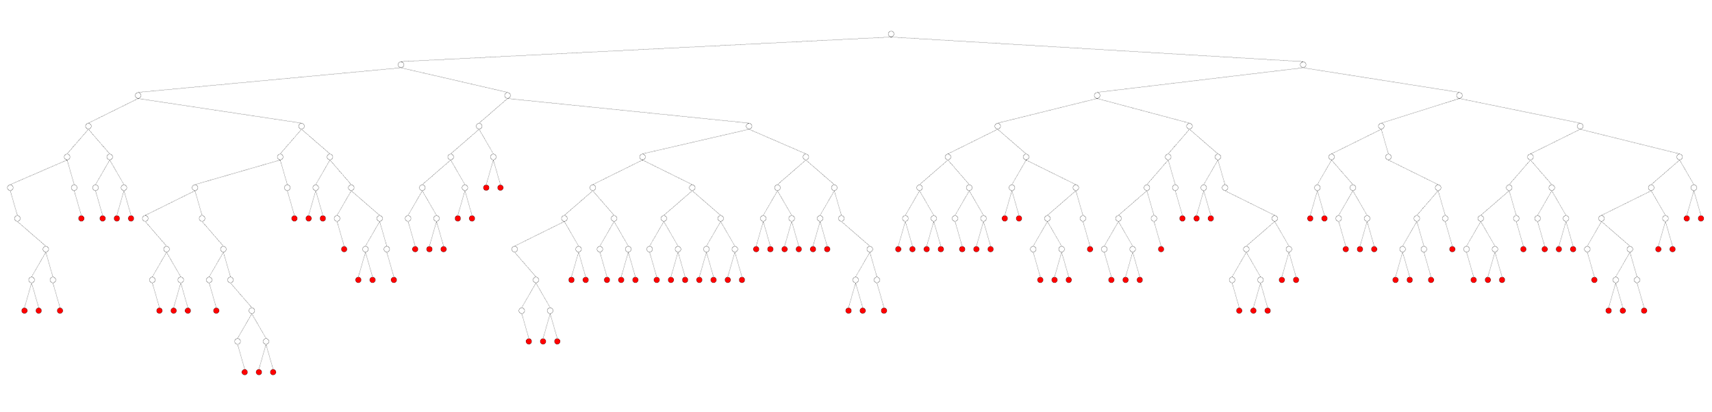
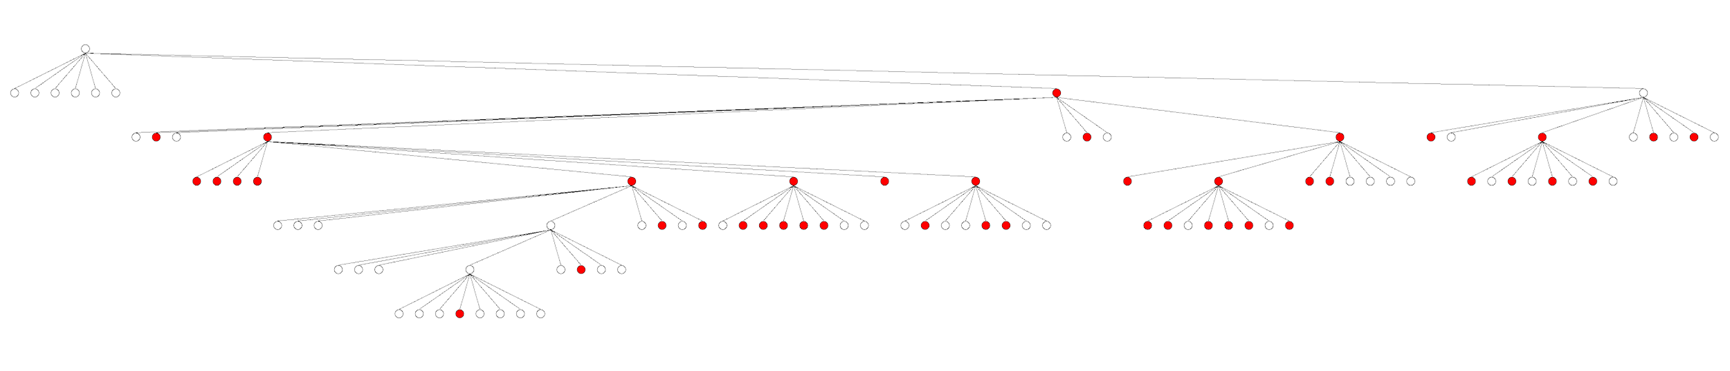
Node structure of a top-down partitioned BVH visualized by the data visualizer
We had to implement our unit tests using the doctest framework.
This is a pretty simple framework that provides the core features of any unit testing framework.
There were two unit test projects in my setup, one for the math library and one for the container library.
For the math library, the Vec2, Vec3, Rect, and Mat3 structures were unit tested, as well as all ray-shape intersection functions.
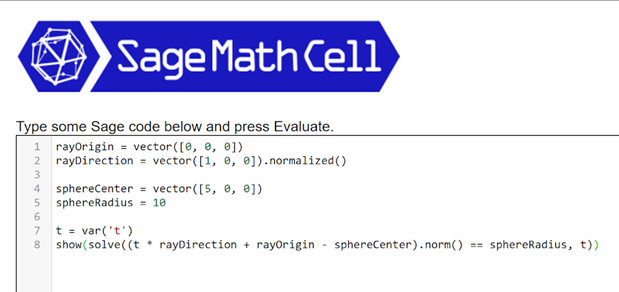
Verified results to assert against were gained from SageMath and other math libraries like glm.
For the container library, the array, optional, stack, string, and vector structures were unit tested, as well as the insertionSort function.
All the structures that were unit tested had tests for all constructors and methods, while the functions simply had use cases to test against. Everything that was tested had multiple tests with different inputs, which would include edge cases and sometimes randomness as well.
Project tags: #3D Math, #C++, #Data-Structures, #Graphics, #UML, #Unit Testing